§ 5. Map projection of maps and how
1. Remember, the a map is different from the globe.
2. Why is inevitable on the map distortion is represented objects?
3. What you know ways to image objects on the cards?
Geographic generalization. Even on the largest scale maps can not (and impractical) show objects with all the details and details. For their selection and make generalizations cartographic generalization.
Generalization determined by the scale of maps, its purpose, theme. The most significant impact scale. Because land area, which in reality has an area of 1 km2, Map scale 1: 10 000 will occupy the 1 dm2, Map scale 1: 100 000 - 1 cm2And the map scale 1: 1000 000 - 1 mm2. Thus, all objects displayed on a large scale map, graphically impossible displayed on maps of small scales. Therefore, when moving to a smaller choose only the most significant scale topography (eg, human items with populations over 10 thousand inhabitants) and those which can be expressed in scale of the maps (eg, rivers longer than 100 km), simplifies form of objects (excluding small rivers and roads gyrus, straightens paths coastlines, borders, etc.).
Map projection. All maps are in some map projection. Photographs projection - A mathematically defined way to image the earth's surface plane (map). The real surface is very complicated and does not match geometric body. To play this on the map surface, it first reflect on the mathematically correct shape (balls) and then transfer it image plane, as if projecting it.
Mapping projections of many, united in their group. First projections for the share type of secondary surface that is used when moving from bullet to plane maps. There are projections cylindrical, when design of the ball is on the surface of the cylinder conical, when supporting surface serves as a cone, and azimuthal, when design is directly on the plane.
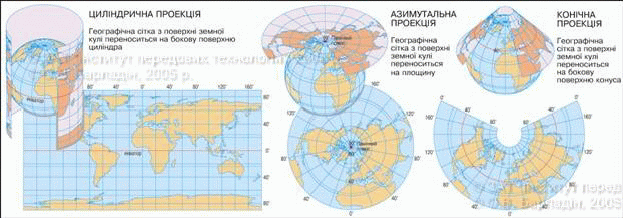
Fig. Cartographic projection by type of secondary surface
Misrepresentation of geographical maps. As you already know the geography course grade 6, a spherical surface of the globe impossible to deploy in a plane without gaps and creases. Thus, any map has certain distortion. Distorted the length of lines, angles, square and form geographical objects. Misrepresentation on the map of the more than most represented on it surface. In planning areas and large maps, depicting small areas of terrain, almost no distortion, but on small-scale maps they are very large. And hence the different scale lengths and areas in different parts of the map.
The nature and size distortions in the map you can see, comparing with the grid degree mesh globe. On the map of all the meridians at each other, parallel are on equal distance from each other. All meridians intersect with parallels at right angles, so the map of all degree grid cells between two neighboring parallels have the same shape and size, and cells between the two neighboring meridians are narrowed and reduced in size with distance in north and south of the equator.
This way, the signs of distortion on the map will: varying shape and size cells between two adjacent parallels (distortion of forms and areas), different length segments parallels between meridians (lines and lengths of distortions different scale in different parts of maps) deviation values between the angles meridians and parallels of 90 ° (angle distortion).
Picturing Earth's surface on a map, it is necessary to take into account the curvature of the Earth and to choose one or another map projection, which avoids distortion of one or weaken more.
Depending the nature and size distortion in conformal mapping is shared, and equally arbitrary. Conformal projection remain without distortion angles and shapes of small objects, but they strongly deformed length line and area objects. For maps, created in equiangular projection, conveniently chart the routes of ships and aircraft, as measured on such maps angles angles closely match the terrain that can be fixed appliances.
Equally projection not distort the space, but the form of objects and angles in them heavily distorted. Random projection have all kinds of distortions, but they are distributed on the map most favorable way. For example, there are projections with minimal distortions in the central part, but they increase sharply at the edges of the map.
For geographical maps of Ukraine mostly used arbitrary conic projection. The maps with the projection of relatively little distorted angles and squares, scale can be considered constant over small distances around any point. Therefore, these maps can roughly measure angles, distances and small areas.
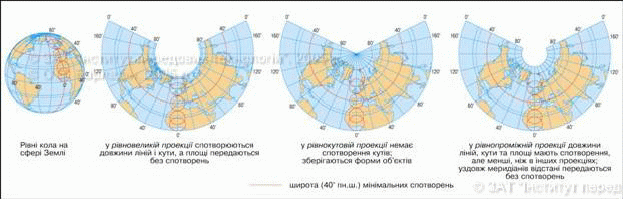
Fig. Geometric image distortion for example conical projections
Types symbols. As you know, to reflect different geographical objects and phenomena processes used on the maps symbols. These include conventional signs, labels, alphabetic and digital mapping, cartographic methods image. There are several kinds of symbols.
Scale (Or Contour) conventional signs transmit valid sizes of objects, which are expressed on a scale map. These signs are forest paths, meadows, marshes, lakes and more. Pozamasshtabnymy notation denote objects that you can not show the scale of the map. For example, factories, airfields, monuments, wells, individual tree locations (their show-punsonamy circles).
EXPLANATORY conventional signs complementary characteristics of the object. For example, Arrow River next to a sign indicates the direction of its flow, drawing deciduous or coniferous trees in the forest path indicates the prevalence of certain breeds.
Methods of maps. On maps, objects, phenomena and processes deliver different ways. Method icon used to image objects not expressed on a scale map. Badges can be geometric (eg industrial centers) to letter (the place of extraction of minerals) or have form of visual images (anchor as a symbol of the sea port).
Way linear marks transfer cards on linear objects: the coastline, rivers, borders, roads, pipelines. They are scaled by their length and configuration, but preferably pozamasshtabni by width.
Way good background show the division of territory to the same qualitative respect of parts. All parts of paint over a different color. This method sends phenomena on the Earth's surface have continuous distribution, ie between the represented territorial parts of the map can not be "blind spots". This way, representing, for example, geological structure area, soils, natural areas, state unit administrative and territorial structure and so on.
Way ranges available for allocation on a map spread some homogeneous phenomena. Areal can display a solid or dotted boundary Tint, hatching, or label pattern. Phenomena represented by this way, unlike those passed way good background, no widespread territorial distribution: on the map they appear as separate "Spots" (glaciers, permafrost, swamps, parks, etc.)..
Way isolines used to display the events that are continuous, uninterrupted and with more or less smooth distribution of the earth's surface. Isolines as you knowledge, this is the line connecting points on the maps, which areas are quantitative indicators of a similar phenomenon. Isolines for example, show high land (horizontal), deep seas (izobaty), temperature air (isotherms), rainfall, salinity of water. To better perception phenomena between neighboring contour plots often paint over the different colors (such as showing the physical relief maps).
Way traffic sign transfer phenomena that move in space (eg, winds and flows). Color and width of a traffic sign can display the characteristics of the phenomenon - cold or warm currents, winds in summer and winter.
Way kartodiahramy used to display absolute values quantitative indicators in some areas. For example, this method shows number of schools or sown area of grain crops in areas Ukraine. Figures may take the form of columns, ribbons, squares, circles or other geometric shapes. Often they are divided into parts according to the structure depicted object. Each of the parts colored in different color and corresponds to some fraction, expressed as a percentage. For example, the chart can be passed structure of schools at their place of location (urban and rural), the structure of sown areas by type of grain crops (wheat, rye, barley, etc.).
Way cartogramms reflect the relative values of quantitative indicators particular areas (eg number of pupils per 1 000 inhabitants of the region, average cereal yields (quintals a hectare) in regions). For cartogramms binding is the presence of scale, which shows that changes within the index.
< --> 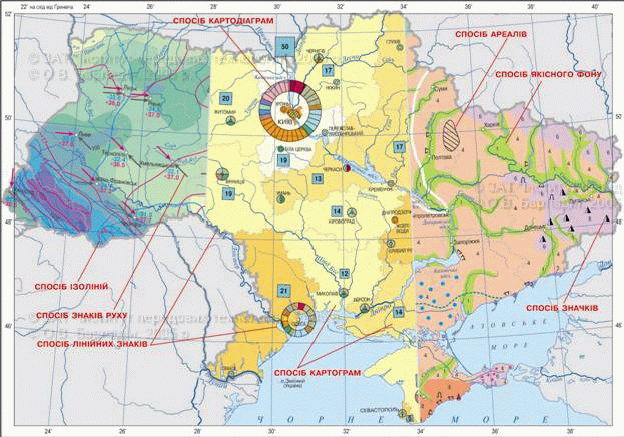
Fig. Methods of maps on the maps
Remember
Map projection - A mathematically defined way image the Earth's surface on the map. Depending on the nature and size of distortions are distinguished projection conformal, and equally arbitrary, by type of secondary surfaces - cylinder, conical and azimuthal.
To symbols on the maps include symbols, signatures, digital signs and means of maps.

Questions and Tasks
1. Why do the maps have distortion? What kind of distortion is on the map world time zones?
2. What is map projection? What are the types you know?
3. Look for Physical map of Ukraine examples of different symbols.
4 *. What are ways of maps that are used on maps "Tectonic structure of Ukraine", "Black and Azov Seas.
 English