CHAPTER II. POPULATION UKRAINE
TOPIC 3. NUMBER, LOCATION AND POPULATION STRUCTURE
§ 5. Number, location and movement of natural population
1. Remember that the population of Ukraine. At what Ukraine is the place for this indicator among the countries of Europe and the world?
2. What are the territory of Ukraine the most suitable for people living in terms of their natural environment?
CHANGE Population. Precise data on the number of residents provide overall country censuses that are conducted throughout its territory and capture rates population of a specific date. Ta-Ki censuses in various parts of Ukraine were Founded in Austria-Hungary (mid nineteenth century.) and the Russian Empire (with the late nineteenth century.) conducted States, which included the Ukrainian lands in the twentieth century. (Including 6 times - in the USSR). General censuses organized more or less regularly about every 10 years. The first (and so far the only) census in an independent Ukraine was held in 2001 In addition, each year is current account of the population at the beginning (January 1tion) or middle (1 July) year.
The population of the Ukraine in more ancient times can be calculated only approximately because of special scientific research. Scientists believe that the XVII art. lived in the Ukrainian lands about 3 million people, and in XVIII. - Is almost 9 million according to the Austrian and Russian censuses conducted in the nineteenth century. on Ukrainian ethnic territory inhabited by 36 million people, including within Modern Ukraine - almost 29 million
During the twentieth century. Ukraine humanity in general increased - until 1993, when reached maximum value - 52,2 million people. However, in the first half XX Art. population Ukraine suffered huge losses - under the wars (the First international, civil and solved from the outside), due to political Repression of links, famines in the Soviet times, during the Second World War. By close Ukraine lost count during those terrible events of 20 million of its citizens. Pre-war level population Ukraine reached only in 1956
Overall population growth in Ukraine was in mainly due to the prevalence of birth rate over the number of dead. However, in the early 90's of the twentieth century. These indicators are equalized, and then the number deaths began to prevail. And as a result, the population in Ukraine diminishing. Population census recorded late 2001 about 48.5 million inhabitants, and the current populace in the country (as January 1, 2008) has nearly 6 million people less than it was in 1993
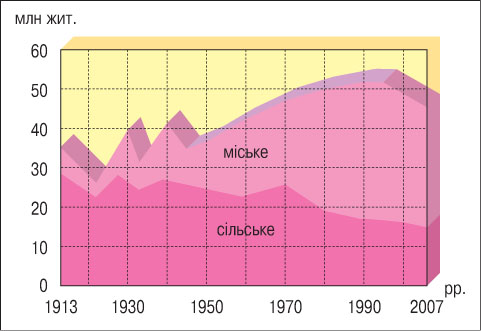
Fig. The population of Ukraine
ACCOMMODATION POPULATION. On population in Ukraine is placed unevenly. First of all allocated 8 regions (with populations over 2 million people each), which generally focuses more as half the population (see annex). The most densely populated have Donetsk, Kiev (With Kyiv City) And Dnepropetrovsk region. In other areas live from 1 to 2 million people each and only one Chernivtsi region - Less than 1 million However, this limits approaching a few regions, which each year lose their inhabitants.
A more accurate picture placement population reflects index density (density) of population - the number of people living in a particular area, to its area. The average population density in Ukraine - 77 people per 1 km2. This figure is much lower than in Western Europe, but higher than Nordic countries and our neighbors - Belarus and the European part Russia.
The highest values of population density observed in the east and west of the country - in the highly industrial Dnieper and Donbas regions (up to 175 persons / km2 in Donetsk regionWhich according to population density is the leading regions of Ukraine) and Carpathian and Transcarpathian regions - (100 persons / km2 and more). In forest-steppe areas of population density close to the average index. Together these regions form in Ukraine baseband resettlement where best natural conditions for life and human activity (favorable climate, fertile soils, an extensive river network, the rich mineral resource). The north and south of this band territory inhabited less often (35 - 55 persons / km2) since they have slightly worse living conditions and human activity. North Woodland part is known as a rather austere land of forests and swamps. South Prairie regions of Ukraine are characterized by arid climate, lack of fresh water. In addition, they were settled later than other regions, which also affected on population. And only in the Southern coast of Crimea in subtropical Climate comfort for the life and work of people much population density increases - an average of 270 persons per 1 km2.
Much larger contrasts in placement and population density observed at mid-level administrative-territorial division of Ukraine. In particular, in urban areas national, regional and national importance, which occupy only 2,5% the country, and lives almost half its population. The average population density there is more than 1450 persons / km2And in many places reaches over 4000 people per 1 km2. Instead of rest of the country, which is in rural areas, average population density - only 40 persons / km2In many areas it is reduced to 20 persons / km2.
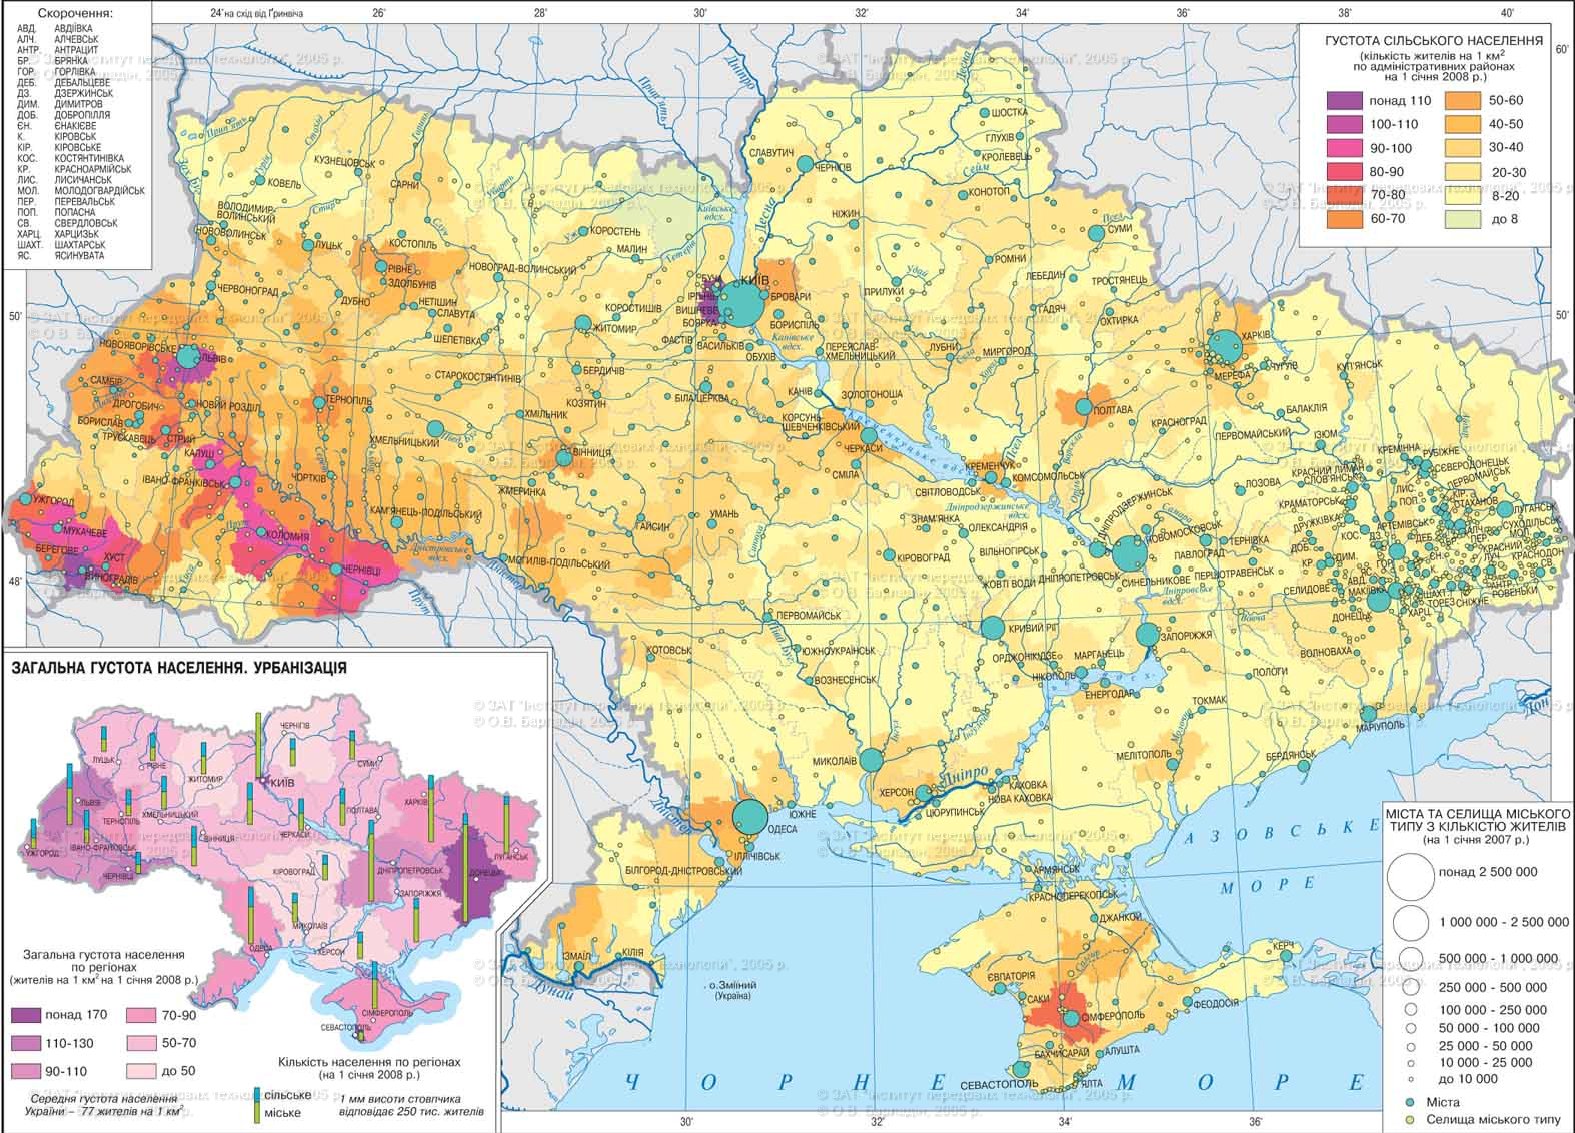
Fig. Population distribution
NATURAL Population movement. The population of the world countries, their regions are in the process continuously update its members, that is it plays. Reproduction or atGuitar movement characterized by indicators imbadzhuvanosti, mortality and natural growth.
Natural population growth (ПП) – The difference between number of people born (Birth, Н) And those that died (mortality, С): PE = N - S. All figures are calculated for the natural movement of a territory for the year in absolute (thousand persons) and relative values (per 1000 inhabitants of the territory, ie ppm - ‰).
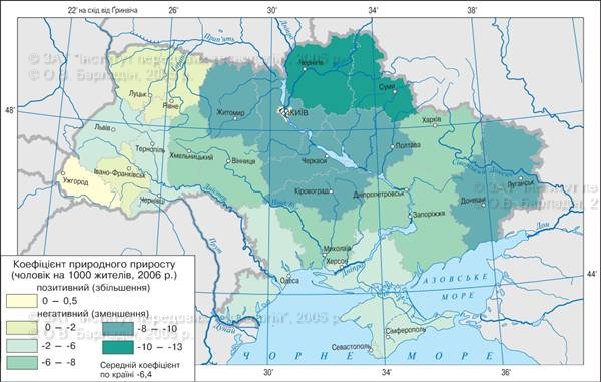
Fig. Natural increase population
Reproduction of the population at different times and
different areas can be extended (N
> S, PP> 0), Simple (N = C
PP = 0) Or restricted (N
Natural Indicators population movement are significant differences in the regions of Ukraine (see annex). The largest natural population loss observed in the northno-eastern, eastern and some central regions (-10 ‰), a leader in the natural reduction is Chernihiv region (-13 ‰). They are also high in areas of central and Polesie Dnieper, somewhat lower - in the southern regions. Western region and in Kyiv at All-background look best, but also have negative natural population growth (- 2 ‰). The only area in which people play close to the simple, and in some years is characterized by even a slight positive growth is Transcarpathia.
DEMOGRAPHIC CONTEXT. Features Reproduction of this or that area shows demographic situation. Its parameters characterizing changes population, its natural and mechanical movement, the distribution of population by sex and age, average length men and women, divorces and population shlyubnosti and others Demographics. Demography - A science that studies the reproduction of the population; name comes from Greek. “demos” – “people”.
The demographic situation in Ukraine as a whole and its individual regions is extremely difficult, as evidenced by the above characteristics Vital. The worsening demographic situation due to many factors: lower level and quality of life of people during the economic crisis, difficulty geoecological situation in all regions of the country aging population, increased performance divorce rates and declining indicatorsKiv marriages, the proliferation of "fashion" in odnoditni family, increasing childlessness young families. In recent years before they added the massive outflow of young people outside country.
Birth rate in Ukraine has long been dropped to a level that is insufficient for the replacement of generations. Mortality increased among all age groups, the main reasons for this - cardiovascular disease, neoplasms, accidents and injuries, suicide. Tallish child mortality under the age of one year (10 children per 1 000 births), which is 2 times higher than in Europe.
The current demographic situation in Ukraine contributes to the so-called depopulation –reduce its total number due to the reduction. The process of depopulation population initially covered the countryside, and eventually the city (see annex 5). In Ukraine there are hundreds of villages during the year in which any child is born. These villages are endangered in the literal sense. Natural increase rural population in general in the country is -10 ‰ (as in Chernihiv region -24 ‰!). In cities, this figure twice higher, but also negative.
To change the demographic situation in the desired direction Powers a demographic policy. This system of administrative, economic, and propaganda other measures aimed at changing the natural movement of population, primarily fertility. The main tasks of demographic policy in Ukraine - raising fertility rates and reducing mortality, especially in childhood. However, the low income population in Ukraine and minor material encouraging families of children at birth by the state for a long time not facilitate effective implementation of population policy. Only in recent years fertility rates and natural growth have increased somewhat. A role in this played a sharp increase in government payments to families on the birth of the first, second, third child and subsequent children.
Remember
Number Ukraine's population during the twentieth century. generally increasing, despite the complicated and tragic pages of its history, it reached the maximum value in 1993 - 52,2 million people; current population is about 46, 5 million people.
AtGuitar population movement characterized by indicators imbadzhuvanosti, mortality and natural growth, what is the difference between indicators imbadzhuvanosti and mortality.
Since 1991, Ukraine has narrowed reprotion of the population that is characterized by negative natural growth.
In Ukraine in general developed highly sophisticated demographic situation, accompanied by depopulation - reduce its total number due to the reduction.
 Questions and Tasks
1. How varied population in Ukraine in XX Art.? What factors influenced these changes?
2. Explain the reasons for uneven population distribution in Ukraine.
3. What is the natural movement of the population? Are there regional differences Vital Ukraine?
4. Describe the current demographic situation in Ukraine. What are the factors of its cause?
5. What is the depopulation of the population? What are the causes?
Geographical problem
Calculate the average annual natural population growth
Ukraine (ППsir) For the period
1956-1970, 1979-1993 and 1993-2008 years. The calculation use the formula: ППsir = ![]() Where Н1and Н0 - Population
respectively at the end and beginning of period k - Number of years in the period.
Where Н1and Н0 - Population
respectively at the end and beginning of period k - Number of years in the period.
On the basis of the results concludes tendency of population growth in the country.
 English