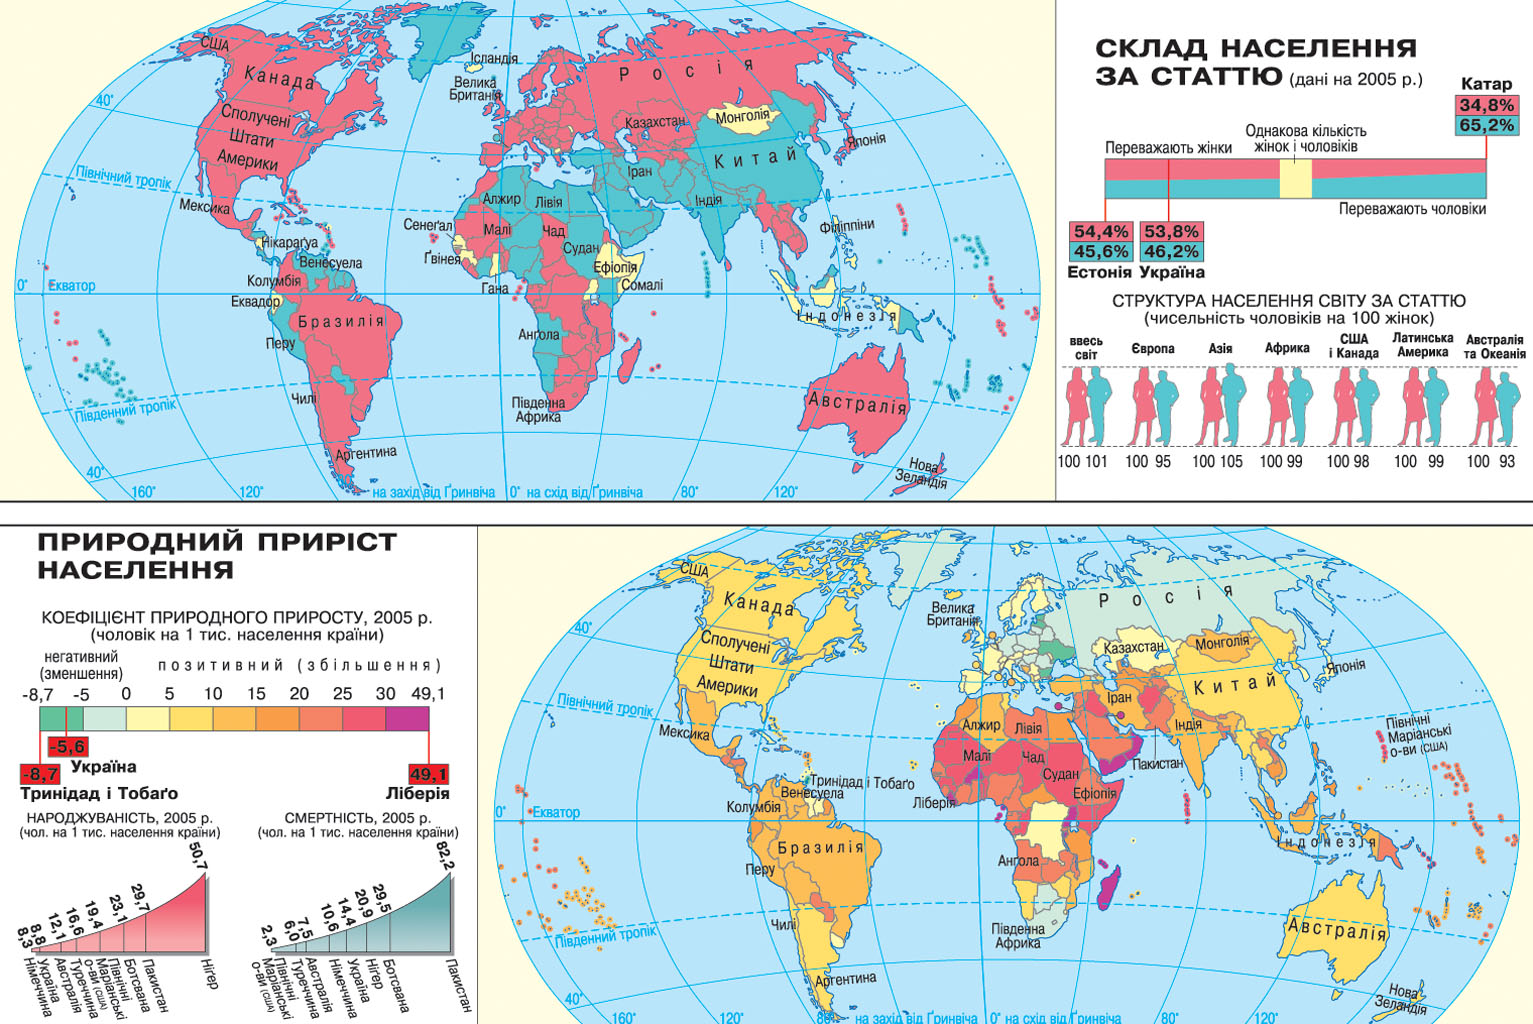
Natural increase depends on many factors. By the XVIII century. World population growth depended mainly on biological processes. At this level of fertility and mortality rates were very high and as a result - a low natural increase (see graph presented with a map of population distribution ). Nowadays everything sensible influence on population reproduction acquire socio-economic factors: the level of welfare and people's living conditions, level of development of medicine, health and nutrition, extent of women participation in social processes, the ratio between urban and rural populations , national and religious traditions of others. Among the global historical reasons that hinder the natural population growth - political upheaval, social crisis, worsening environmental conditions.
ratio of natural increase can be positive, negative or zero, characterizing, respectively, increase, decrease or invariance population territory due to different ratios between fertility and mortality. In most countries there is a positive natural growth. Rapid growth rates of natural increase was called the population explosion and transformed into one with global challenges, the solution is possible provided that governments adequate population policy.
prevalence mortality over the birth rate - negative natural increase is called depopulation. The phenomenon of depopulation is typical for transition countries (Ukraine, Latvia, Hungary, Bulgaria) and some developed European countries (Germany, Sweden).
sex composition of population - the ratio of men and women, which depends on biological, historical and social reasons. In general, men in the world much more than women. Among the countries where the dominant male half of the population - China, India, Turkey. Predominance of men in these countries caused by historically disadvantaged women (early marriage, early birth and many children, especially mentality, etc.).
In most countries the situation is reversed. The most tangible part of predominance of women in countries that actively participated in the Second World War and other military conflicts. Genetically caused the average life expectancy of women for 5-8 years longer than men.
addition to the maps are the corresponding diagrams (pyramids), which is submitted together with the population distribution map . Gender and age pyramid shows the ratio of male and female population by age category as a percentage. Pyramid is for a particular country for a year. There are two types of population age structure corresponding to the types of population reproduction. First ( regressive ) type of age structure is formed when narrowed (I) type of population reproduction. It is characterized by a low proportion of young people (under 15) and a large proportion of elderly (over 55-65 years). This distribution of population by age characterized mainly developed countries (Japan, USA). The second ( progressive ) type of age are developing countries with advanced (II) type of population reproduction. Here is a very significant proportion of children and adolescents with a low percentage elderly population (India).
World population


 English